Predictive Maintenance
This is a work in progress where I’ll publish some brief commentary on predictive maintenance and outline my hybrid CNN-RNN model for remaining useful life modeling.
Preliminaries
What is remaining useful life (RUL)?
RUL is a class of machine learning problems in which a model is trained to predict how many steps are left until a piece of machinery will fail. In my view, this is an important reframing of a very old problem, one that has normally been solved either with survival analysis or sliding window models. In the former, a Cox Proportional Hazards model (or a Weibull model, if you’re feeling parametric) is used to estimate the hazard ratio for the process in question; in the latter, either an RNN or a simple logit or probit is used to estimate the instantaneous probability of failure in some predefined window.
Both of these methods are perfectly fine, but have their drawbacks. In the case of the Cox model, you’re operating within the broad generalized linear model (GLM) framework, so you have to assume a linear relationship between model parameters. For the sliding window model, you need to prespecify the size of the prediction window, which can lead to some pretty arbitrary choices.
WTTE-RNN as an alternative
A couple of years ago, a master’s student in Sweden called Egil Martinsson came up with a brilliant new way of working on this problem. You can check out his here, blog post here, and thesis here.
The long and short of it is that Egil created a new framework for modeling RUL. Rather than seeking to estimate a probability of survival, his approach uses a recurrent neural network to estimate the parameters of a Weibull distribution, which itself is used to describe the number of steps remaining until failure. He called it WTTE-RNN, which stands for Weibull Time-to-Event - Recurrent Neural Network. This to me is incredibly cool, and I was very excited about its potential when I first encountered it - so much so that I immediately dove into some RUL problems online in an effort to validate his method and create a couple of business cases for Quantillion (the startup I currently work for).
The PHM 2012 Challenge
Data
With the brief history lesson now complete, let’s bring things back to the (near) present. The PHM-2012 challenge is the use case I decided to opt for, and your task is to use ball bearing failure data to fit a model that can predict the RUL of a bunch of other ball bearings. In principle it’s pretty simple, but in reality the combination of odd time increments and an unfavorable proportion of training to test data make this pretty challenging. To cut a long story short, the approach taken was to carry out a Fourier transform on the data, normalize everything to the [-1,1] interval, and then fit an LSTM model to this data. You then end up with 1024-dimension data with a variable number of time points.
As a first step, I decided to just follow Egil’s modeling approach, coding everything in PyTorch, including the loss function derived in his thesis. In PyTorch, this looks like:
class DWeibull_Loss(torch.nn.Module):

    def __init__(self):
        super(DWeibull_Loss, self).__init__()

    def forward(self, y_, a_, b_):
        hazard0 = torch.pow((y_ + 1e-35)/a_, b_)
        hazard1 = torch.pow((y_ + 1)/a_, b_)
        return -1*torch.mean(torch.log(torch.exp(hazard1-hazard0) - 1.0) - hazard1)
Which basically the negative log likelihood of the discrete Weibull.
The data itself contained 8 training examples, each with between 600 and 2500 observations. However, this doesn’t tell the full story, as in the actual training routine I wrote some code that randomly sampled a 100-period slice of data, which used as input to the model. The target was then the RUL of the last row in this slice of data.
Model 1
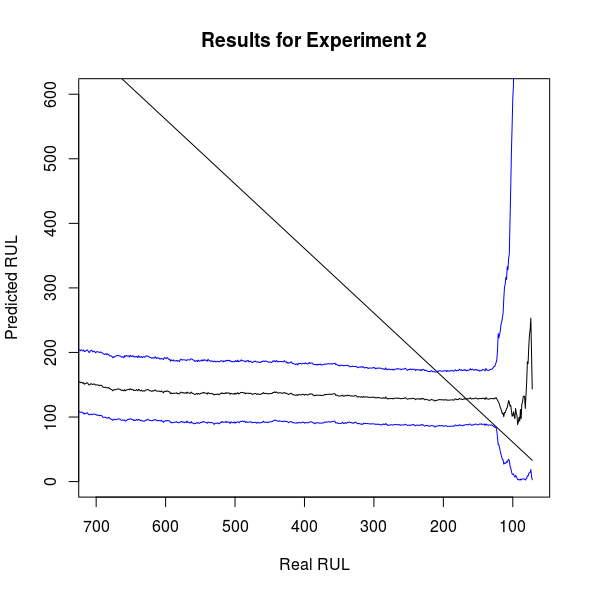
The above image displays the test performance of the first approach I took, which was a simple LSTM model that estimated the parameters of a Weibull distribution as per Egil’s work. There’s a fair amount going on here, so I’ll just give you a brief description of what’s going on. The linear slope is the real RUL for this test example, the smooth black line is the median of the distribution estimated by the model, and the two blue lines are the confidence intervals for this prediction. Because the WTTE-RNN estimates the parameters of a distribution with well-studied asymptotic properties and known moments, it seems logical to me that you would leverage these features of the model to capture uncertainty. Fortunately, this is pretty easy, as the quantile function of the Weibull distribution is very simple:
So we can easily plug in the probabilities of interest in the above equation for a given set of parameters and return upper and low bounds for the confidence interval.
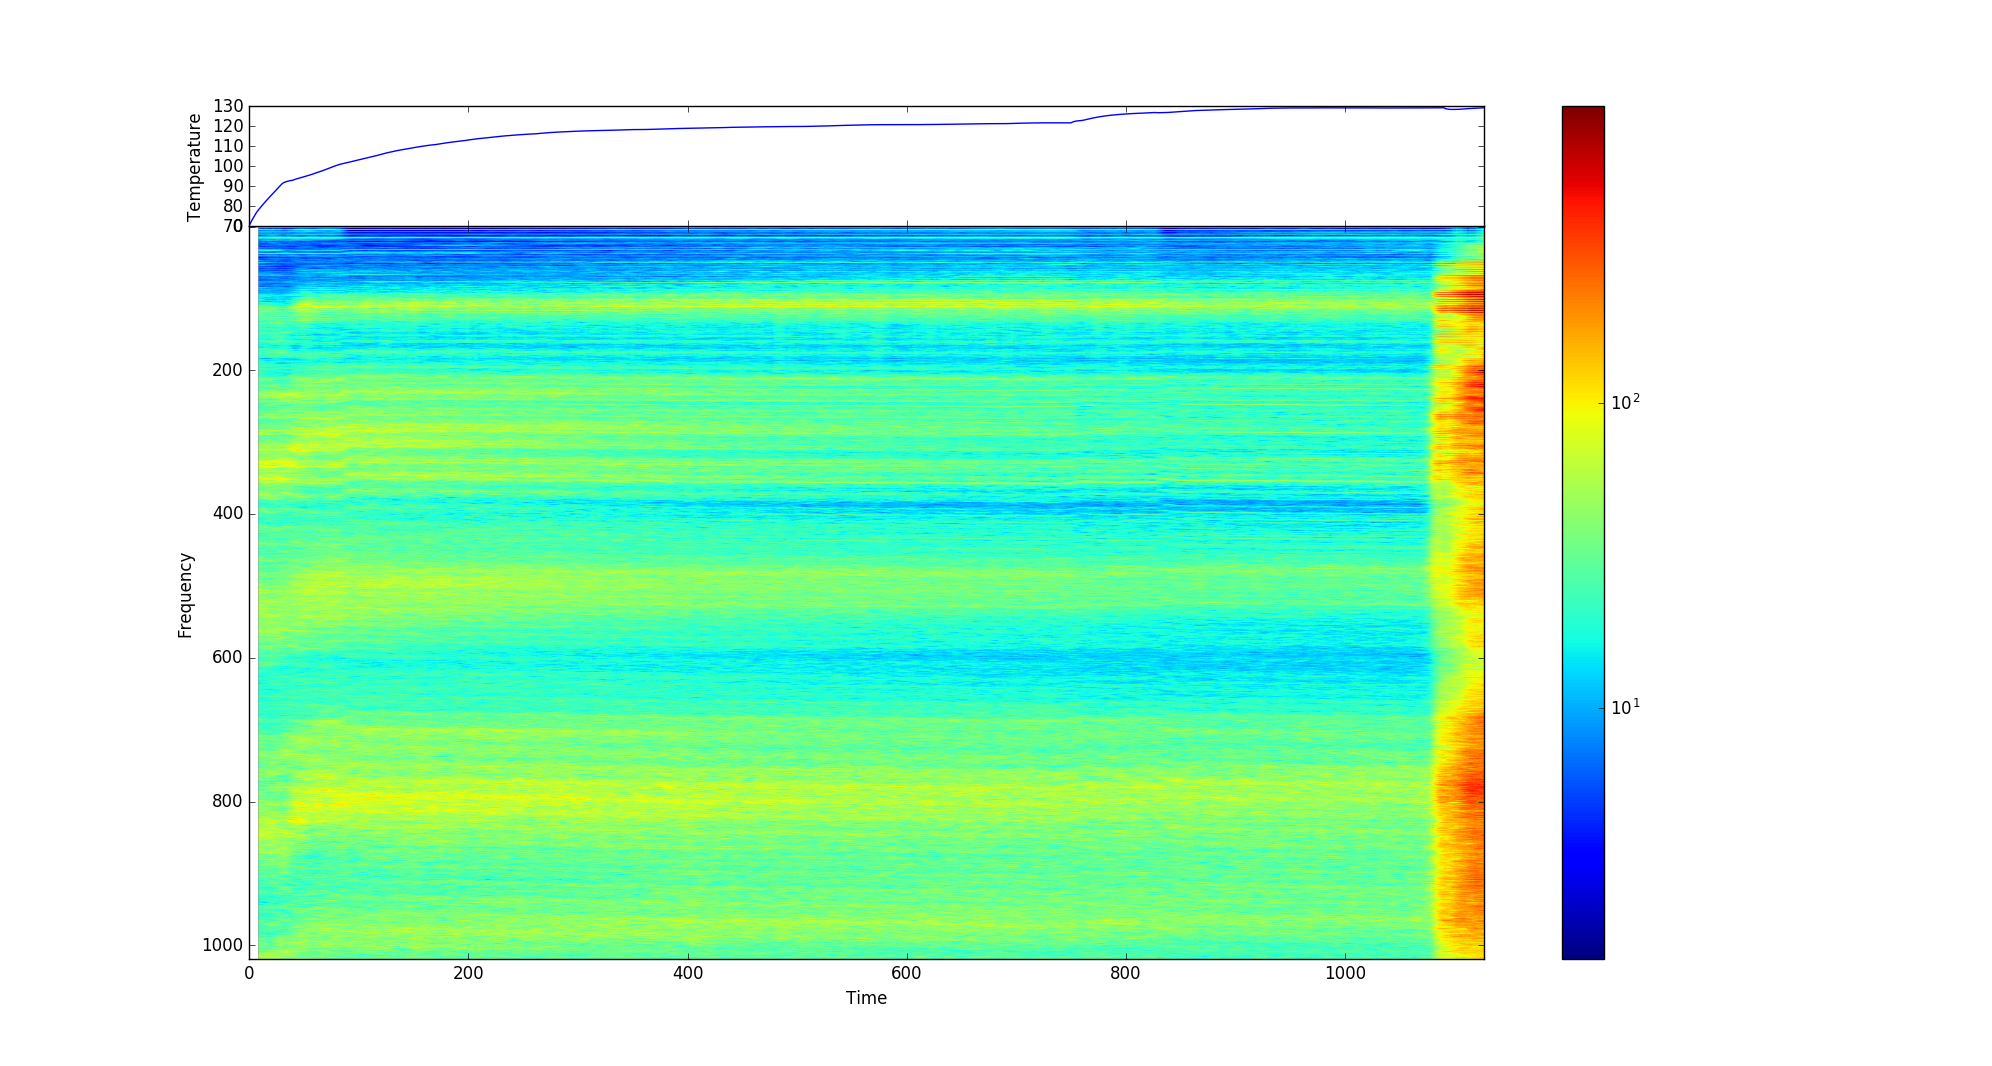
Now, if the task was to predict RUL then this model fails totally, as it seems to think that most of the readings are identical until a sudden upsurge in activity blows out the confidence interval. As we can see from the spectogram above, this is hardly a surprising shortcoming of the model. There’s an absolutely huge period of invariance that the model has to somehow map to an outcome, a task that any reasonable sequence model would struggle with. A new approach was clearly needed!
Model 2: CNN-RNN hybrid
After a fair amount of tinkering with the model and some ungodly training times on AWS, I decided to switch things up. It seemed to me that there was still a clear temporal component to the problem, so a LSTM model was still warranted; however, I also decided it might be worth trying to incorporate visual tools, too. The end result was what I call a CNN-RNN hybrid, which does the following:
- Take a fixed slice of the data as above
- Pass this through an LSTM model and store the output
- At the same time, pass the same input through a CNN model with 2 convolutional layers with 32 and 64 filters respectively, kernel size of 5, max pooling, and ReLU non-linearities
- Flatten the output from both neural networks and concatenate it
- Pass this output through another neural network that estimates the parameters of a Weibull distribution
Please note, this model is incredibly bulky and took about a week to train on a dedicated AWS server instance with a p3.2xlarge GPU. However, I’m pretty happy with the progress I’ve made so far.

